READ ARTICLES ABOUT DATA AND METRICS

tools of the trade.jpg

POWER COMPANY CLIMBING ASSESSMENT

First, thank you for considering helping us out with this project. It’s a massive one, and we need your help to make it something special that we can all use in the future. As you all know, more and more science and data is finding it’s way into the training for climbing world. We’re ecstatic about that, but want to make sure that we know what the data means and that it’s important. Asking the community to participate has been a resounding success. We now have over 600 climbers in our data set!

Thanks for helping out. It means the world to us that you believe in what we’re building.

Step 1: Download the Assessment Instructions.

We suggest that you read through and get a feel for things before jumping in. Patience!

Step 2: Complete the Measurements.

Take as long as you need. We lay out an ideal session to rest ratio, but it’s up to you and we don’t want to take up too much of your valuable climbing time.

Step 3: Enter Your Assessment Results.

Once you’ve completed everything, click the link below (also provided in the Instructions PDF) and enter all of your results. You’ll also be asked a series of questions about your climbing and your physiology so that we can better correlate your numbers to climbing levels.

 Thank you! Your participation will help make this an even more valuable resource for coaches and climbers!

SELF MEASURES

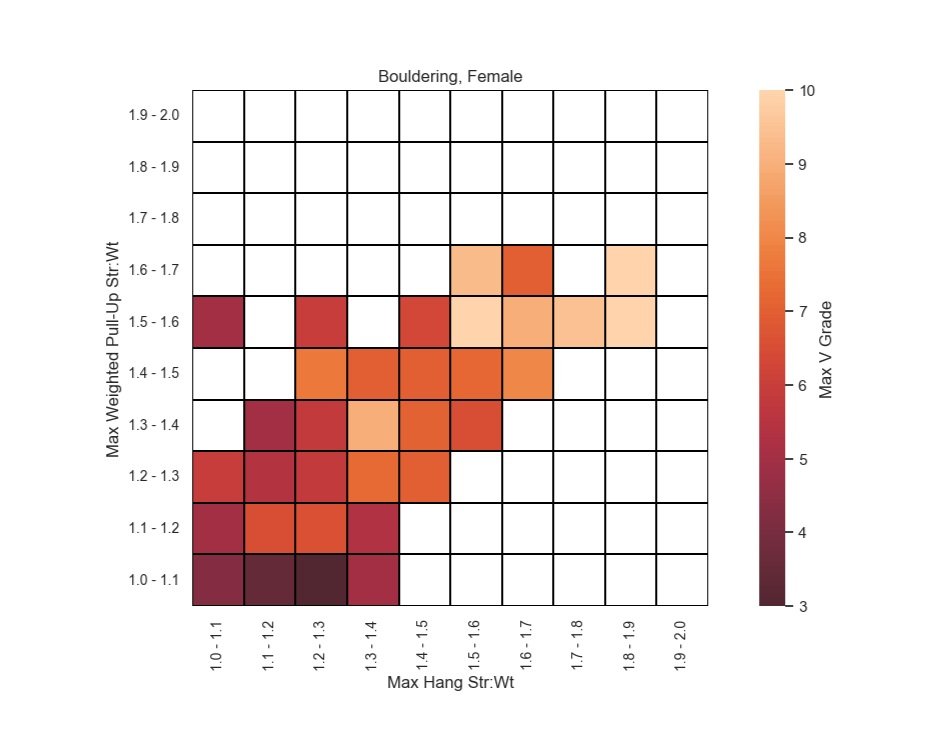
Note: The box plots and heat maps in this post will be regularly updated based on our current dataset. Most recent update: October 2022.


To effectively use some of these charts, you will need to know your strength to weight ratio for the given measurement. If you’ve not already calculated this, you can find it by using the following formula:

Str:wt ratio = (Body Weight (lb) + Added Weight (lb)) / Body Weight (lb)

Please keep in mind that all of this data is simply giving you a place to start or a general target. Climbing is a complicated sport that is largely skill based, and there are no exactly perfect measurements or correlations.


BOULDERING MEASUREMENTS

Males

Box plot showing data for male climbers' max hang strength to weight ratio (Y axis) and max boulder grade (X axis).
Box plot showing data for male climbers' max weighted pull up strength to weight ratio (Y axis) and max boulder grade (X axis).
Box plot showing data for male climbers' time for repeaters at bodyweight (Y axis) and max boulder grade (X axis).
Box plot showing data for male climbers' max pull up reps (Y axis) and max boulder grade (X axis).

Females

Box plot showing data for female climbers' max hang strength to weight ratio (Y axis) and max boulder grade (X axis).
Box plot showing data for female climbers' max weighted pull up strength to weight ratio (Y axis) and max boulder grade (X axis).
Box plot showing data for female climbers' time for repeaters at bodyweight (Y axis) and max boulder grade (X axis).
Box plot showing data for female climbers' max pull up reps (Y axis) and max boulder grade (X axis).
Heat map titled "Bouldering, Male" displays strength to weigh ratio for max weighted pull ups (Y axis) and max weighted hang (X axis) with color gradient representing max V grade.
Heat map titled "Bouldering, Female" displays strength to weigh ratio for max weighted pull ups (Y axis) and max weighted hang (X axis) with color gradient representing max V grade.

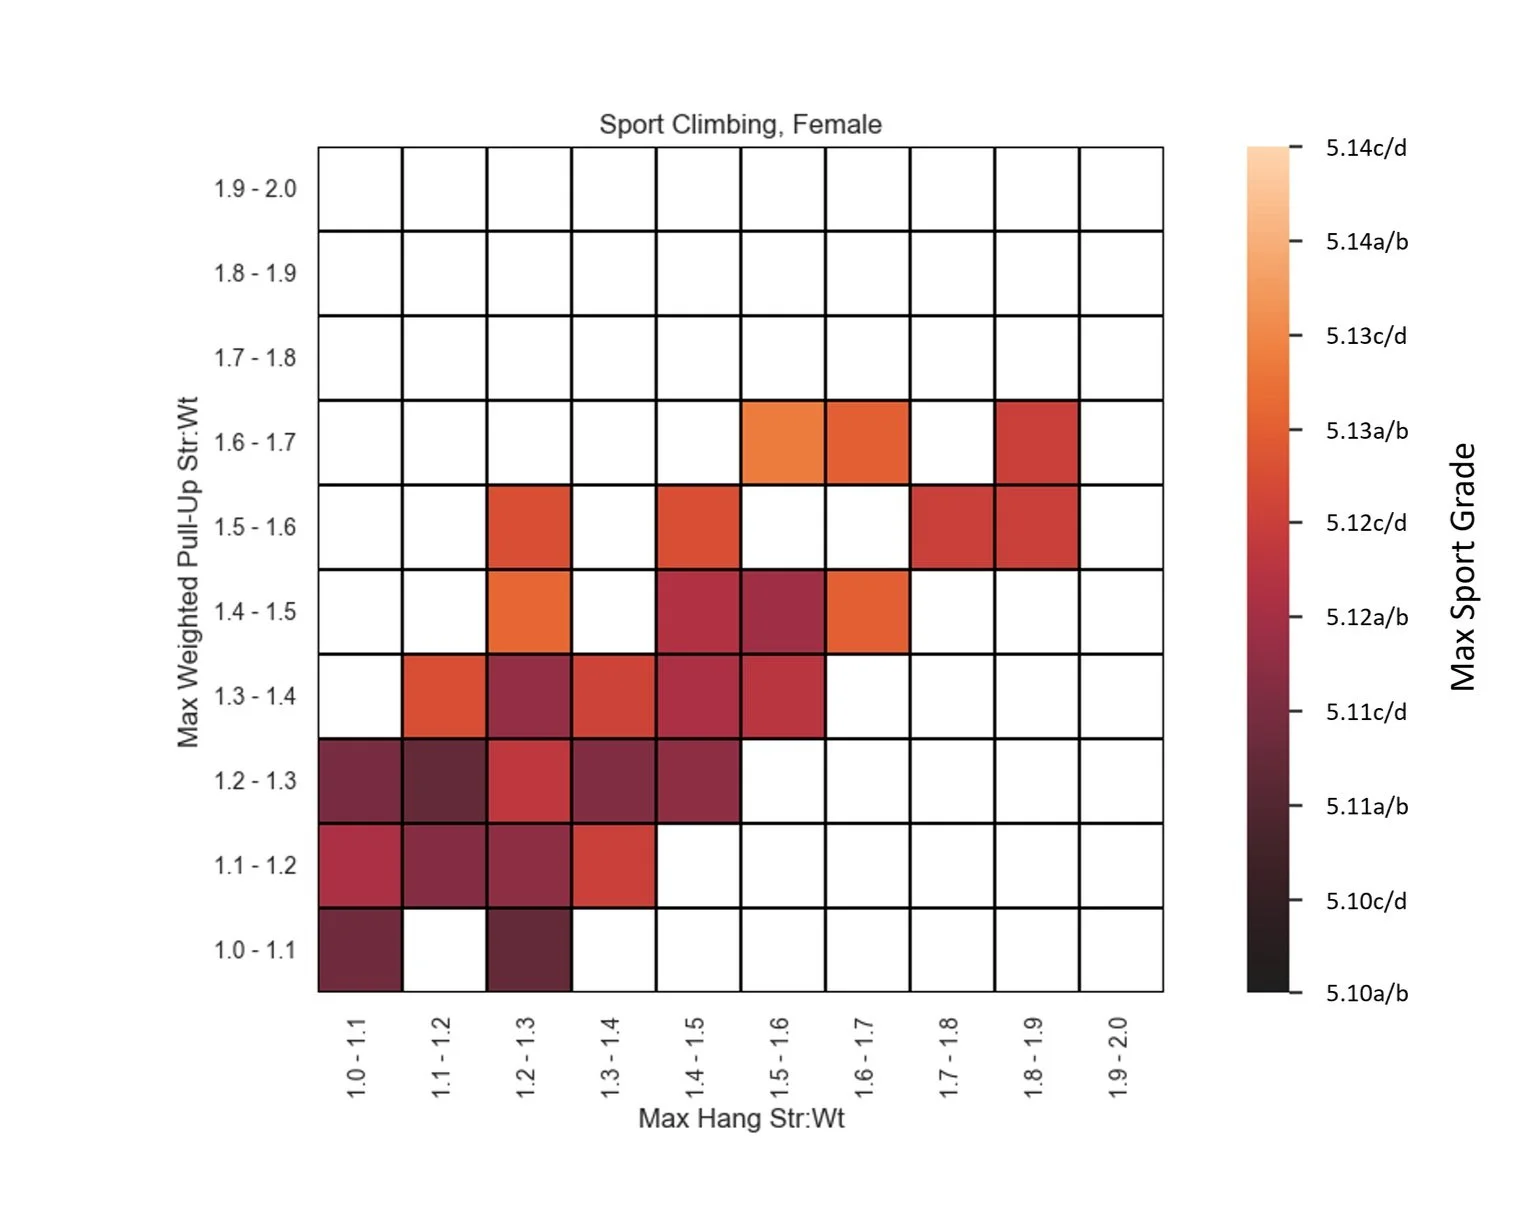
SPORT CLIMBING MEASUREMENTS

Males

Box plot showing data for male climbers' max hang strength to weight ratio (Y axis) and max sport climbing grade (X axis).
Box plot showing data for male climbers' max weighted pull up strength to weight ratio (Y axis) and max sport climbing grade (X axis).
Box plot showing data for male climbers' time for repeaters at bodyweight (Y axis) and max sport climbing grade (X axis).
Box plot showing data for male climbers' max pull up reps (Y axis) and max sport climbing grade (X axis).

Females

Box plot showing data for female climbers' max hang strength to weight ratio (Y axis) and max sport climbing grade (X axis).
Box plot showing data for female climbers' max weighted pull up strength to weight ratio (Y axis) and max sport climbing grade (X axis).
Box plot showing data for female climbers' time for repeaters at bodyweight (Y axis) and max sport climbing grade (X axis).
Box plot showing data for female climbers' max pull up reps (Y axis) and max sport climbing grade (X axis).
Heat map titled "Sport Climbing, Male" displays strength to weigh ratio for max weighted pull ups (Y axis) and max weighted hang (X axis) with color gradient representing max Yosemite decimal grade.
Heat map titled "Sport Climbing, Female" displays strength to weigh ratio for max weighted pull ups (Y axis) and max weighted hang (X axis) with color gradient representing max Yosemite decimal grade.